<< Back to Media
The Use of Business Intelligence Tools to Optimize Organizational Performance
August 11, 2021
Businesses of all types have the potential to make faster and more effective decisions by utilizing emerging business intelligence tools. A business intelligence (BI) tool is an application designed to collect, transform, visualize, and analyze large amounts of data to facilitate decision making and enhance business performance. Drawing quick meaningful conclusions from raw data sources like cumbersome spreadsheets can be quite challenging for anyone. BI tools make this much easier by providing firms with the ability to structure data in a meaningful way to produce insightful visualizations and reports. One of the most valuable aspects of modern BI is that one does not have to be an IT specialist or experienced data analyst to reap the benefits — many BI tools are self-service and allow for business users of all backgrounds, at all levels, to easily visualize and engage with data.
What is Data Visualization?

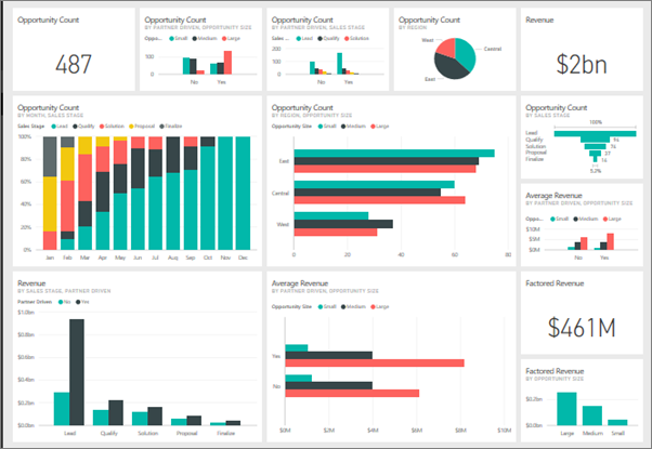
Source: Charts are from Microsoft Power BI
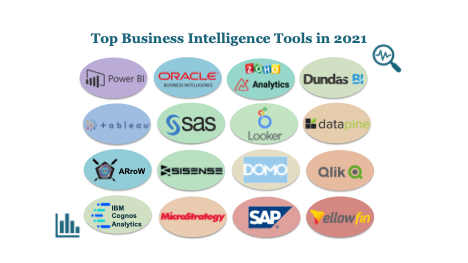
Data visualization is one of the most important areas of data analysis in today’s world. Companies often have data stored in many different places which may make it difficult to see the big picture. BI tools allow users to unify data from diverse sources which can provide a holistic view of an organization’s operations. Some popular BI tools for data visualization in 2021 include Tableau, Power BI, and Qlik Sense. With these platforms, users can simply import data from various sources like files, servers, or databases and organize it into clean, useable, high-quality data. With the click of a button, users can then create visually appealing charts, graphs, maps, and other depictions that display data in real-time.
These applications include numerous features that allow for customization and filtering of data, enabling users to manipulate the visualizations and gather specific data insights. Users can create reports and dashboards that allow for months and even years of data to be condensed into a single snapshot providing past, present, or future visions. In addition to facilitating data analysis and data-driven decision-making, BI platforms allow organizations to collaborate and improve transparency across departments while maintaining information security. Organizations can also increase competitive advantage with the help of BI. By analyzing the market and their own performance within that market, companies can monitor and keep up with changes in the industry.
BI Tools at Washington Business Dynamics
Business intelligence tools are useful across many different industries including government, financial services, manufacturing, retail, health, automotive, entertainment, and more. At Washington Business Dynamics (WBD), we lead our government clients toward more effective data management, allowing them to make more informed business decisions.
WBD designed ARroW (Acquisition Requirement Workflow), a custom SharePoint-based acquisition tool to manage and track the flow of documentation throughout the procurement process, specifically for U.S. government acquisition. This tool allows WBD’s clients to keep their acquisition files and data secure, while leveraging SharePoint’s capabilities, to make the user input process simple and effortless. Government contracting officers and requirement owners can easily submit their requirements for an award with the option to upload supporting documents. The tool then assists users in tracking the development and processing of acquisition award packages. ARroW also allows customization of user authorization to access specific documents at certain stages in the process, which ensures that government information remains secure and protected. WBD is currently working with a client from the U.S. Department of Defense (DoD) with an annual average contract portfolio of $1.2 billion, who has been utilizing the ARroW tool for over a year, successfully improving the speed, efficacy, and security of the procurement process.
In addition to ARroW, WBD also uses well-known business intelligence tools, such as Microsoft Power BI, to help clients make data-informed decisions. Power BI is a business analytics service that allows users to transform data sources into meaningful, visually engaging, and interactive insights. WBD currently uses Power BI to create detailed data reports and dashboards for our Department of Homeland Security client FEMA (The Federal Emergency Management Agency) for purposes including tracking the implementation of new systems, reporting employee certification status, and monitoring performance on strategic initiatives. Using this tool, we can provide access to real-time data visualizations and display data for our client in a more transparent way, allowing them to efficiently track progress, identify issues, and optimize the decision-making process.

Leveraging data is essential for effective decision-making. All companies have the potential to benefit from BI, by gaining key insight into day-to-day operations and determining ways to improve future performance. WBD encourages its clients to adopt the use of business intelligence tools and a data-driven approach for reaching their strategic goals. Fortunately, the U.S. Federal Government has taken steps toward building a more data-driven culture. The Federal Data Strategy puts action steps in place to “leverage the full value of federal data for mission, service, and the public good by guiding the Federal Government in practicing ethical governance, conscious design, and a learning culture.” Organizations that make steps toward adopting new data strategies and embracing this learning culture will likely improve organizational performance and see both short-term and long-term success.
Author: Hannah Lopez, Senior Associate at WBD, is an IT data analytics professional engaged with the Department of Homeland Security (DHS) and the Federal Emergency Management Agency (FEMA).
